
Melbourne's Transit Dilemma: Unravelling the Threads of Urban Mobility
Victoria, standing as a cornerstone of Australia's cultural landscape, is both cherished by its residents and admired by the world. Within Australia, we are hailed as the ‘Garden State’ or the ‘Education State’. Internationally, we are recognised for hosting one of the most liveable cities on the globe – Melbourne. A city renowned for its authentic coffee shops and the iconic trams that glide along its streets, seemingly the pulse that sustains its urban rhythm. However, our public transport system extends beyond our famed tram network, encompassing approximately 400 regular bus routes and 15 train lines servicing metropolitan Melbourne. Together, these networks intricately weave the fabric of daily life, connecting work, study, and home for residents and visitors alike.
But beneath the surface, does our public transport network truly live up to its reputation?
To answer this, we must first grasp what constitutes public transport in Victoria. Within our borders, there are three primary modes of travel beyond personal vehicles: trains, buses, and trams. While ferries also exist, they occupy a niche space and are not as integral to the daily commute for most Victorians.
How frequently do our fellow Victorians embrace public transport?

Figure 1: Method of Travel to Work, 2021 (Source: profile.id)
The answer, quite frankly, may not surprise you.
In fact, compared to the convenience and prevalence of private car usage, public transport adoption falls notably short. For a state celebrated globally as a beacon of progressiveness, with a government investing a substantial $112 billion since 2014 into planning, constructing, operating, and enhancing our transport infrastructure, it's perplexing to witness the underutilization of public transport among significant portions of the populace. While we may outperform other regions in Australia, settling for domestic comparative advantage hardly reflects our aspirations of having a world-leading integrated and sustainable transport system in line with our high livability standards. It's as though we're drifting towards a caricature of America 2.0 rather than embodying the efficiency of Europe's public transit systems, with sprawling car-centric urban development overshadowing the potential for sustainable and accessible transportation networks.

Figure 2: Vehicle ownership per 1,000 people in G20 countries and New Zealand. (Data Source: Australia's biggest city has a car problem. What should Melbourne do to fix it? - ABC News)
What, then, are the root causes of this discrepancy?
Two key factors, revealed from my analysis, contribute significantly to this phenomenon (though they may not be the sole culprits): Melbourne's urban sprawl and the lack of reliability in its public transport system.
The first key issue is the outward expansion of our city poses a big challenge for our public transport system. Nearly a decade ago, Plan Melbourne predicted that by 2051, Melbourne's population would reach 7.7 million, growing about 2% each year, consequently necessitating 1.57 million new homes to be built.
We still hold onto the idea of the Australian Dream – having a home with a backyard, much like our American counterparts. But as our city spreads out, our public transport struggles to keep pace. Instead of growing upwards, we're spreading horizontally. And this is where we see most of these new homes being built: at the edges of the city, mainly in the north and west.

Figure 3: Number of approved building permits in 2022 by suburb (Victoria). (Data Source: Self-Analysis of Victorian Building Authority data)
As Melbourne's suburbs keep growing, it's getting harder to connect these new areas to the main transport network. This makes public transport less useful, so more people opt for private cars for the sake of convenience.
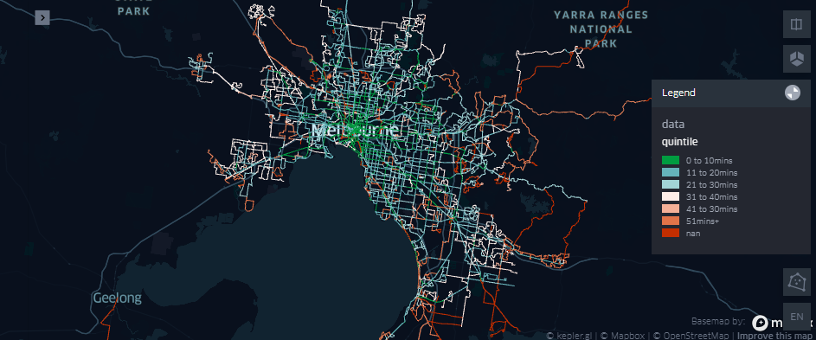
Figure 4: Public Transport Frequency in Victoria on a Weekday for Metro Train, Bus and Trams (Source: Self-analysis of GTFS data)
Another significant issue is the lack of reliability and trustworthiness of the public transport system. Many Melburnians can relate to the frustration of frequent train line disruptions or bus delays. Despite the introduction of real-time updates, the reliability of our public transport remains questionable. For instance, I vividly recall waiting for a bus that was supposedly just 2 minutes away, only to realise later that it had already passed by several minutes earlier. This left me stranded at the stop for an additional 20 minutes, uncertain when the next bus would arrive.
Moreover, the frequency of services poses a significant inconvenience for Melburnians, particularly those residing further from the city centre. While the Melbourne CBD enjoys a robust network of trams, buses, and trains, venturing into the suburban outskirts reveals a stark contrast. Here, reliance on buses becomes paramount, as trains predominantly funnel commuters towards a single destination – Flinders Street – owing to their radial routes.
However, the frequency of bus and train services during off-peak hours leaves much to be desired, with waits stretching to 20 or 30 minutes between services. This inconvenience is exacerbated on weekends or after-hours, where service intervals may extend to 40 minutes or even an hour, if available at all.
Ultimately, the current public transport system fails to accommodate the diverse needs of all commuters throughout the day. Instead of adopting a turn-up-and-go approach (usually considered to be 10min frequencies), akin to the efficient timetabling seen in cities like Singapore or London, Melbourne's public transport system leaves much room for improvement.
The second key issue is the inequity within Victoria's public transport system exacerbates socioeconomic disparities, particularly in outer suburbs. These areas tend to accommodate residents with lower socioeconomic status, drawn primarily by the affordability of housing and taking a slice of the ‘Australian Dream’.

Figure 6: Percentage of black spots and breakdown of LGA by SEIFA Index (Source: Self-analysis of ABS Census 2021 and research article: GIS Analysis of Adequate Accessibility to Public Transportation in Metropolitan Areas)
The accompanying graph illustrates a clear correlation between inner Local Government Areas (LGAs) such as Melbourne, Port Phillip, and Yarra—characterised by higher affluence and lower levels of socioeconomic disadvantage—with a lower percentage of blank spots. Blank spots are defined as regions where people reside but lack access to any form of public transport within a certain catchment area. Conversely, LGAs further from the city centre, typically housing more socioeconomically disadvantaged populations, exhibit a dearth of public transport options.
A discernible trend emerges in Melbourne, where lower-income households gravitate towards the more affordable outer suburbs. However, the allure of cheaper housing comes at a cost, as these areas suffer from inadequate public transport services, resulting in longer commutes and delayed access to essential community amenities.

Figure 7: Percentage of households with vehicle ownership levels as specified in each tile (Source: Self-analysis of ABS Census 2016 data)
For many residents in the outer suburbs, public transport isn't a luxury—it's a necessity for participation in society. However, the current system fails to adequately meet their needs. Inadequate public transport services force reliance on car ownership, compounding financial strain in already disadvantaged areas. This can be seen in Figure 7, where households with 2 or more cars are primarily concentrated in the outer suburbs and beyond, while areas with no car ownership are primarily concentrated in the CBD and neighbouring suburbs, which have greater access to trams, trains, and buses. In fact, approximately 82% of growth area residents used their own cars to travel to work in 2016 compared to Melbourne’s average of 71%. This reliance on cars not only contributes to higher living costs but also exacerbates environmental concerns and traffic congestion.
The concept of social exclusion looms large in this context. Limited access to transportation restricts individuals' ability to reach essential services, employment opportunities, education facilities, and social engagements. As a result, vulnerable populations are further marginalised, trapped in a cycle of exclusion due to inadequate transport infrastructure.

Figure 8: Median distance travelled for residents’ journey to work across Melbourne, 2016; Growth area councils shown in red. (Source: Infrastructure Victoria analysis of Australian Bureau of Statistics (ABS))
The reliance on cars further compounds the issue, particularly for lower-income households. As petrol prices rise, so too does the financial burden on those dependent on car travel. Growth areas and outer suburbs, that are already poorly served by public transport, have higher rates of car ownership (as seen in Figure 7) and longer travel distances to access essential services (as seen in Figure 8).

Figure 9: VAMPIRE data for Metropolitan Melbourne. (Source: RMIT, VAMPIRE for Australian Capital Cities (SA1) [data set], https://aurin.org.au/, 2016, accessed 1 May 2024.)
The Vulnerability Assessment for Mortgage, Petroleum, and Inflation Risks and Expenditure (VAMPIRE) index, as depicted in Figure 9, highlights that areas often lacking adequate public transport also face heightened vulnerability to the financial risks mentioned. Many outer suburban and growth areas in Melbourne are categorised as 'high' to 'very high' vulnerability, emphasising the pressing need for targeted interventions to tackle transportation disparities.
These challenges underscore the necessity for Melbourne to overhaul its public transport system.
So, what's the solution?
If there was a simple answer, then I probably wouldn't be writing this report. However, we can draw inspiration from successful public transport systems in neighbouring cities to find a way forward. One of the most pressing issues to address is the frequency of services. We need to transform our public transport system from one where we constantly check timetables to a turn-up-and-go system. Progress is already underway with the impending unveiling of the Metro Tunnel in 2025. This project holds promise in relieving congestion in the City Loop and paving the way for more frequent services across all metro lines. Although the government has not provided full details of these changes, hints of timetabling adjustments offer hope for improvements on the horizon.

Figure 10: Time Savings for each train line after the opening of the Metro Tunnel (Source: ABC News - How much time will you save due to the Metro Tunnel? This much ...)
Another crucial aspect is to enhance service provision to Local Government Areas (LGAs) with inadequate or limited public transport options. As illustrated by the earlier graph, LGAs like Cardinia or Yarra Ranges are still underserved by public transport and require immediate attention. While building new train stations or expanding the tram network may not be feasible due to cost constraints, there's a pressing need to redesign the bus networks, particularly in the outer regions.
A recent report by Infrastructure Victoria, titled 'Fast, frequent, fair: How buses can better connect Melbourne,' offers valuable insights and recommendations for bus reform. One such suggestion is to increase the frequency of bus services in outer suburbs, which is projected to provide a significant cost benefit of $1.40 for every dollar invested by the government. Moreover, the implementation of priority lanes for buses on high-frequency routes and the introduction of bus rapid transit systems can effectively reduce travel times for passengers, making public transport a more attractive option for families currently reliant on cars.
Looking ahead, a key aspect of the solution lies in reconsidering the way we plan the growth of our cities. Instead of continuing to sprawl outward, there's merit in incentivizing developers to build upward in gentrified areas. By doing so, we can maximise existing infrastructure and minimise the need for extensive new developments on the outskirts. Compact suburbs also offer residents increased access to various transportation options, including public transport, walking, and cycling, which can lead to shorter trip lengths and reduced travel times. This approach allows us to redirect resources towards enhancing infrastructure within our established areas, rather than constantly expanding to accommodate new communities far from the Melbourne CBD.
However, it must be noted that there exists challenges, such as high land prices, construction costs, planning system risks, community opposition, and uncertainties regarding development assessment decisions impact the feasibility of building higher density homes in these areas. To this extent, it is important for any future policy considerations to carefully consider the preferences and opinions of residents.
So, how does Melbourne's public transport fare in the grand scheme of things?
It's undeniably impressive. However, considering the issues surrounding frequency, reliability, equity, and urban planning, it's evident that there's significant potential for improvement within Melbourne's public transport system.
References:
(2023). Fast, frequent, fair: How buses can better connect Melbourne [Review of Fast, frequent, fair: How buses can better connect Melbourne]. Infrastructure Victoria.
Victoria, the Garden State of Australia. Trove. (n.d.). https://nla.gov.au/nla.obj-352202375/view?partId=nla.obj-352207139
About the education state. Find, connect, shape your Victorian Government. (2024, April 8). https://www.vic.gov.au/about-the-education-state
Metro and Regional Buses. (2023, November 15). https://www.vic.gov.au/metro-and-regional-buses
Who we are. Metro Trains. (n.d.). https://www.metrotrains.com.au/corporate/who-we-are/
Public Transport Victoria. (2024, April 30). Ferries. https://www.ptv.vic.gov.au/more/travelling-on-the-network/ferries/
Method of travel to work | Australia | Community profile. (n.d.). Profile.id.com.au. https://profile.id.com.au/australia/travel-to-work?WebID=110#:~:text=Victoria&text=On%20Census%20Day%202021%20in
Department of Treasury and Finance (2023) Victorian Budget 2023/24: Doing What Matters Retrieved from https://www.budget.vic.gov.au/getting-victorians-home-sooner-and-safer
Transport Integration Act 2010 (Vic)
Victoria. Department of Environment, Land, Water and Planning, author & Victoria. Department of Environment, Land, Water and Planning, issuing body. (2019). Plan Melbourne 2017 - 2050 : addendum 2019 Retrieved May 2, 2024, from http://nla.gov.au/nla.obj-2924357337
Melbourne trains get real-time arrival data. (n.d.). ITnews. Retrieved May 3, 2024, from https://www.itnews.com.au/news/melbourne-trains-get-real-time-arrival-data-439777
(2023). Fast, frequent, fair: How buses can better connect Melbourne [Review of Fast, frequent, fair: How buses can better connect Melbourne]. Infrastructure Victoria.
Promoting “Turn up and go” public transport. (2015, August 17). Daniel Bowen. https://danielbowen.com/2015/08/17/promoting-tuag/
Build, V. B. (2023, September 21). Metro Tunnel Project frequently asked questions. Victoria’s Big Build. https://bigbuild.vic.gov.au/projects/metro-tunnel/about/faq
Daley, J. (2015, March 16). Inner City v Outer Suburbs: where you live really does determine what you get. Grattan Institute. https://grattan.edu.au/news/inner-city-v-outer-suburbs-where-you-live-really-does-determine-what-you-get/
Alamri S, Adhinugraha K, Allheeib N, Taniar D. GIS Analysis of Adequate Accessibility to Public Transportation in Metropolitan Areas. ISPRS International Journal of Geo-Information. 2023; 12(5):180. https://doi.org/10.3390/ijgi12050180
(2022). Get on board: Making the most of Melbourne’s buses – discussion paper [Review of Get on board: Making the most of Melbourne’s buses – discussion paper]. Infrastructure Victoria.
Currie, G., & Senbergs, Z. (n.d.). Exploring Forced Car Ownership in Metropolitan Melbourne [Review of Exploring Forced Car Ownership in Metropolitan Melbourne]. ATRF Organising Committee. Retrieved May 1, 2024, from https://australasiantransportresearchforum.org.au/exploring-forced-car-ownership-in-metropolitan-melbourne/
Build, V. B. (2023, September 21). Metro Tunnel Project frequently asked questions. Victoria’s Big Build. https://bigbuild.vic.gov.au/projects/metro-tunnel/about/faq
Jacks, T. (2018, June 6). How much time will you save due to the Metro Tunnel? This much ... The Age. https://www.theage.com.au/national/victoria/how-much-time-will-you-save-due-to-the-metro-tunnel-this-much-20180606-p4zjpx.html
(2023). Fast, frequent, fair: How buses can better connect Melbourne [Review of Fast, frequent, fair: How buses can better connect Melbourne]. Infrastructure Victoria.
Victoria. Department of Environment, Land, Water and Planning, author & Victoria. Department of Environment, Land, Water and Planning, issuing body. (2019). Plan Melbourne 2017 - 2050 : addendum 2019 Retrieved May 2, 2024, from http://nla.gov.au/nla.obj-2924357337
(2023). Our home choices: How more housing options can make better use of Victoria’s infrastructure [Review of Our home choices: How more housing options can make better use of Victoria’s infrastructure]. Infrastructure Victoria.